
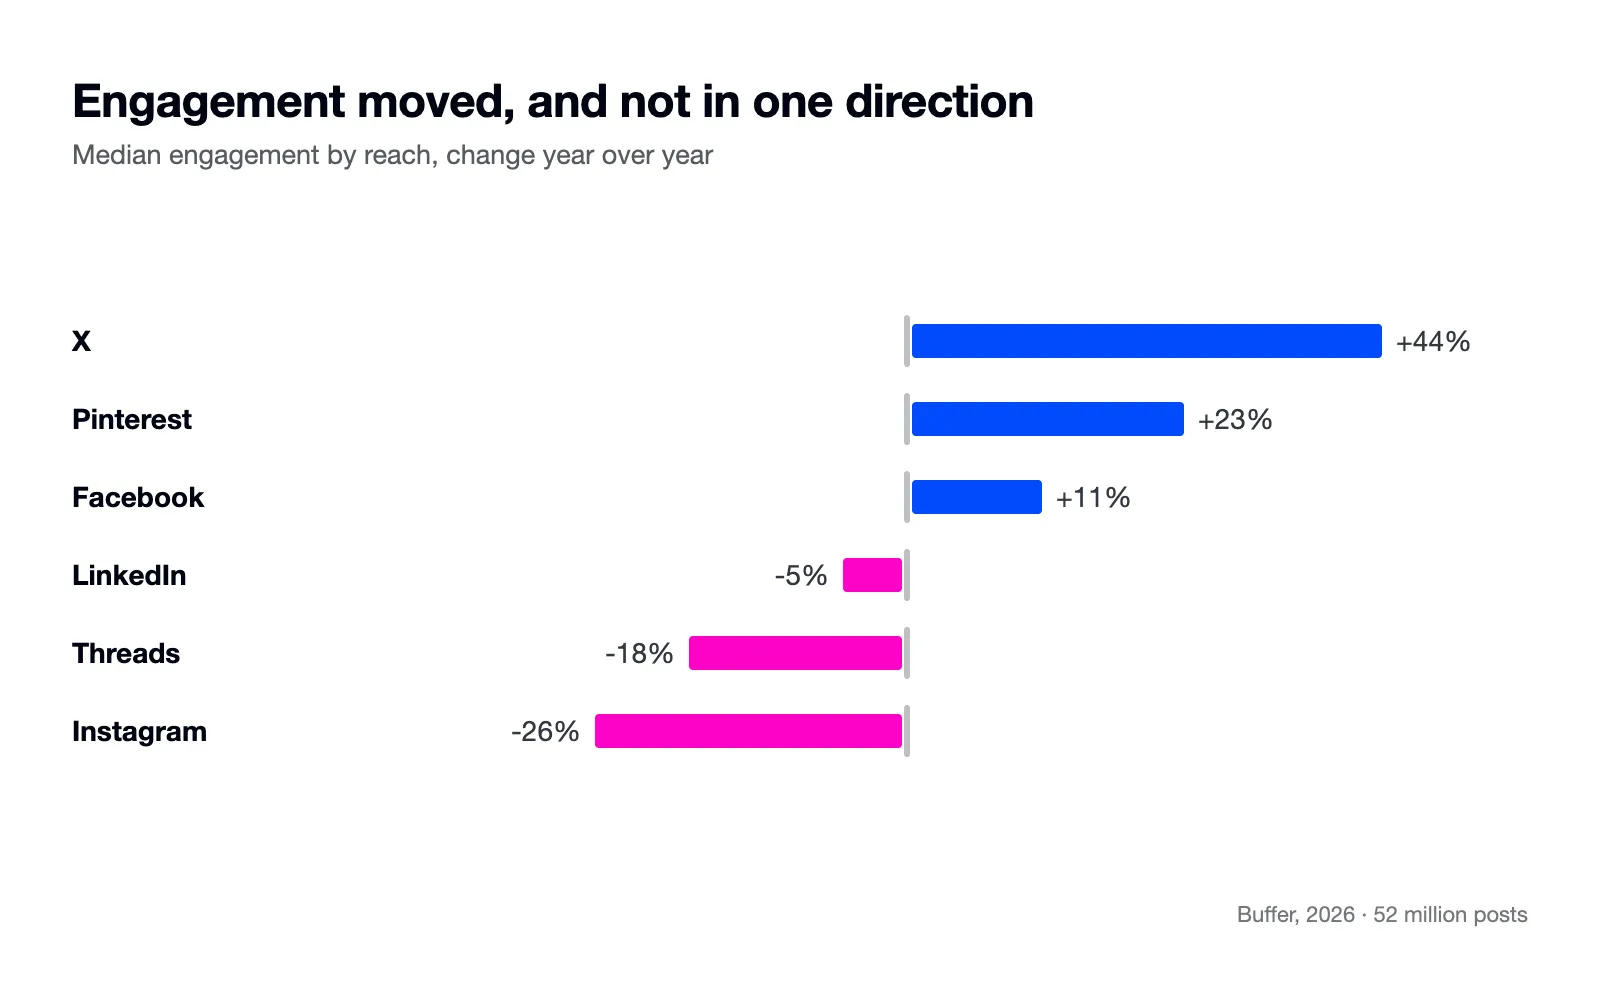
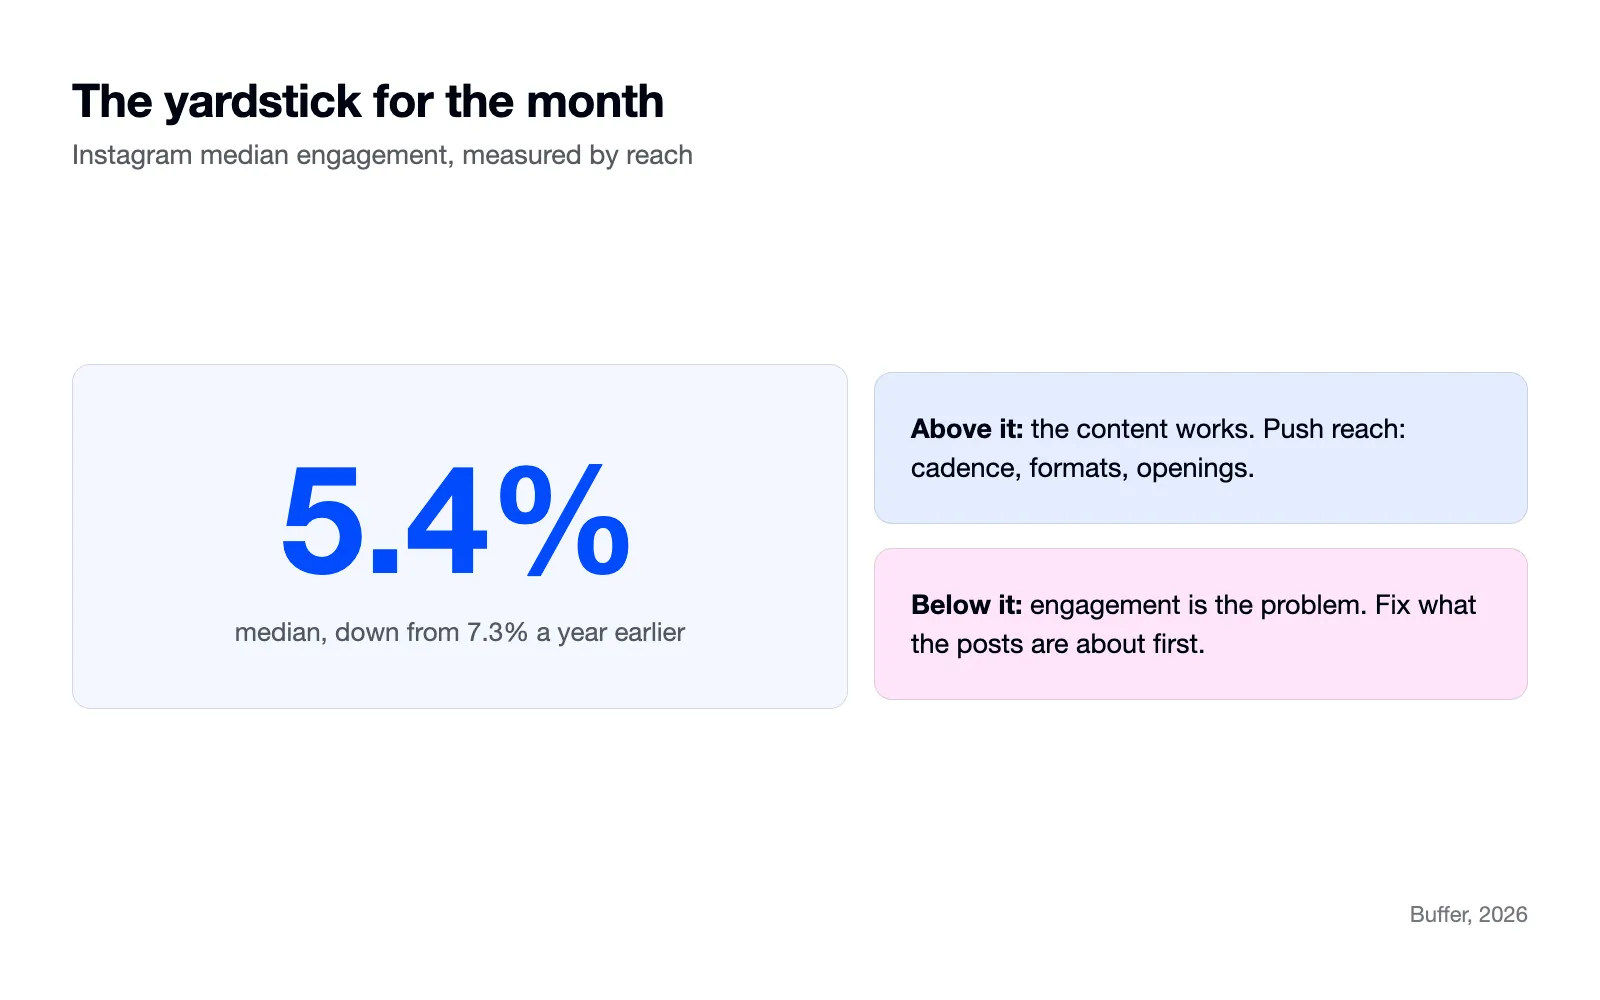
Your engagement is down because Instagram shows every account to fewer people than it used to, not because your content got worse. Buffer's 2026 engagement report, built on 52 million posts, puts Instagram's median engagement rate near 5.4%, down from 7.3% a year earlier. That is a 26% drop, and it landed on almost everyone at once.
The second number explains the first. Socialinsider's 2026 benchmarks found brands published 35% more Reels year over year, and Reels reach fell 35% over the same stretch. More video went in. The same amount of attention came out. Every post now reaches a smaller share of the same audience.
So the honest starting point is that some of your drop is the platform and some of it is yours to fix. The work is telling those two apart. What follows are the same checks we run on client accounts, in the order we run them.
First, make sure you're measuring the right thing
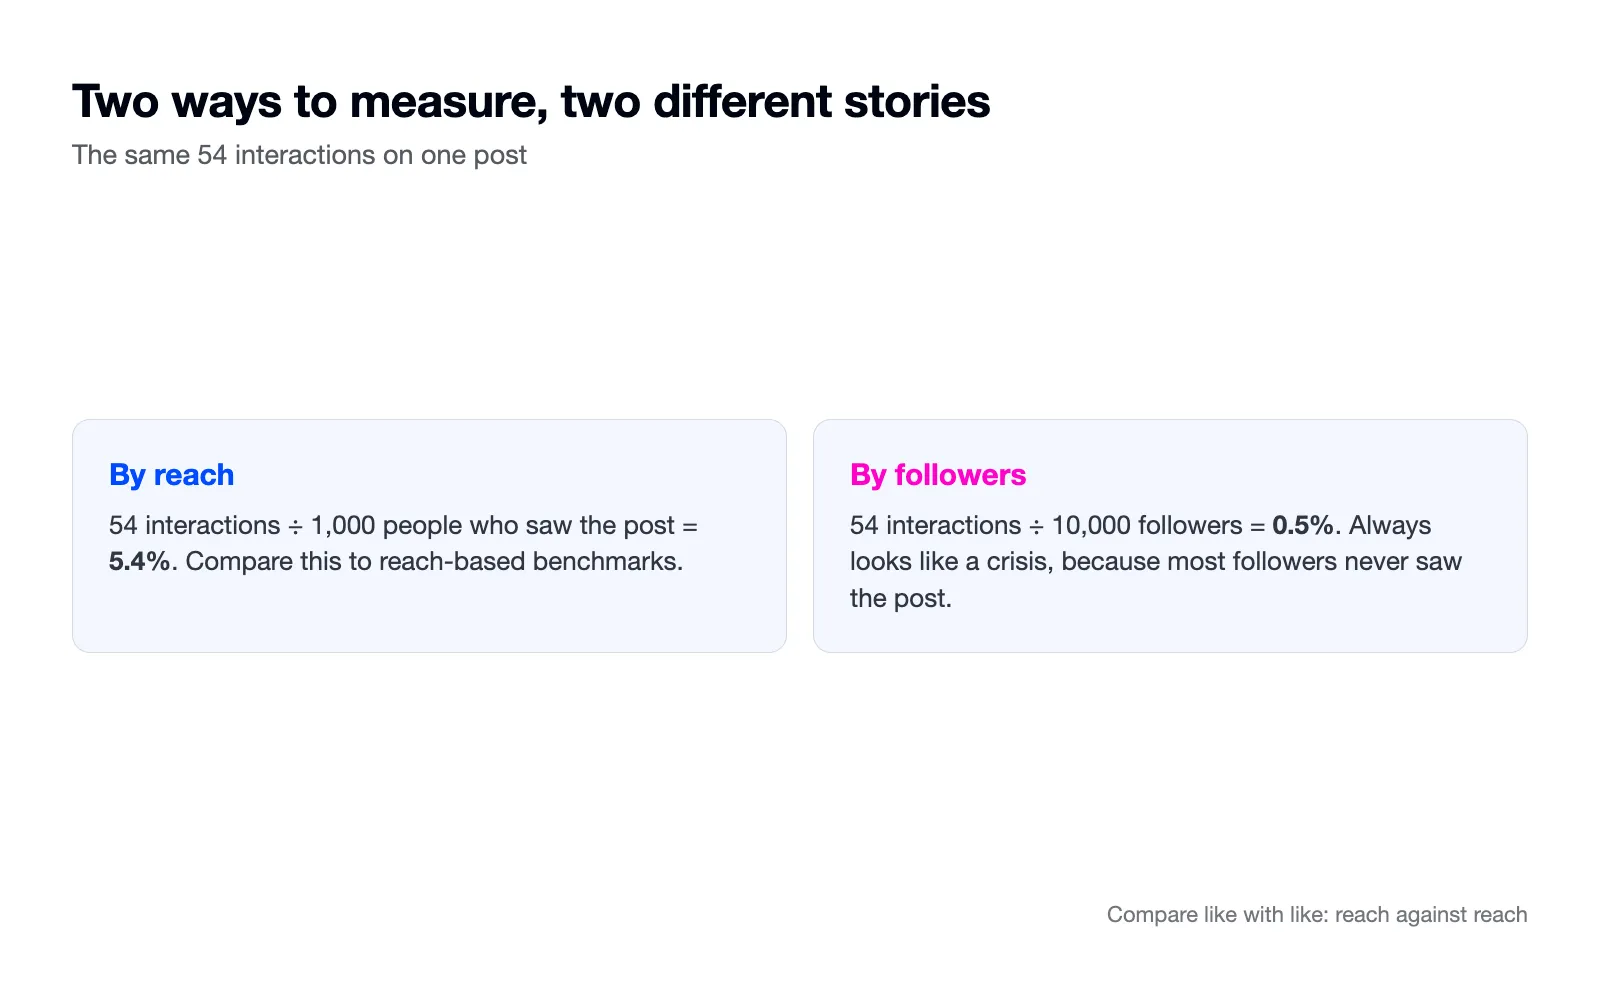
There are two ways to calculate an engagement rate, and mixing them up is the fastest way to panic. Engagement by followers divides your interactions by your follower count. Engagement by reach divides them by the people who actually saw the post. Because Instagram shows your posts to a small share of your followers, the first number is always tiny and always looks like a crisis.
You may have seen figures like 0.48% quoted as Instagram's average. That is a follower-based rate. Buffer's 5.4% median is reach-based. Both are real, and they describe different things. Compare your reach-based rate to the reach-based benchmark. If you compare across the two methods, you will conclude your account is dying when it is average.
Open your insights, take interactions divided by reach for your last 20 posts, and write the number down. That is your baseline for everything below.
Check one: your last 90 days, split by format
Formats do not perform equally, and the gap moves. Socialinsider's quarterly benchmarks have carousels and Reels trading the top spot for engagement, with single images trailing both. Your account has its own version of that ranking, and 90 days of insights will show it.
Sort your posts by reach-based engagement and look at the top ten. Count how many are carousels, how many are Reels, how many are images. Then look at what you actually publish most. On the accounts we audit, those two lists disagree more often than not: the brand posts Reels five times a week while its carousels quietly outperform them.
Shift your mix toward what your audience holds, not what the platform is loudest about.
Check two: consistency, not volume
Buffer analyzed 100,000 accounts and found that regular posting earns five times the engagement of sporadic posting. Not more posting. Regular posting. The account that shows up three times a week, every week, beats the account that posts daily for a fortnight and then goes dark for a month.
Look at your own posting history for the last quarter. Count the gaps. If your calendar shows bursts and silences, the fix costs nothing: pick a number you can sustain in a bad week, and hold it. Buffer's recommendation for Instagram is three to five posts a week, and the low end of that range done steadily beats the high end done in spurts.
Check three: what the algorithm now rewards
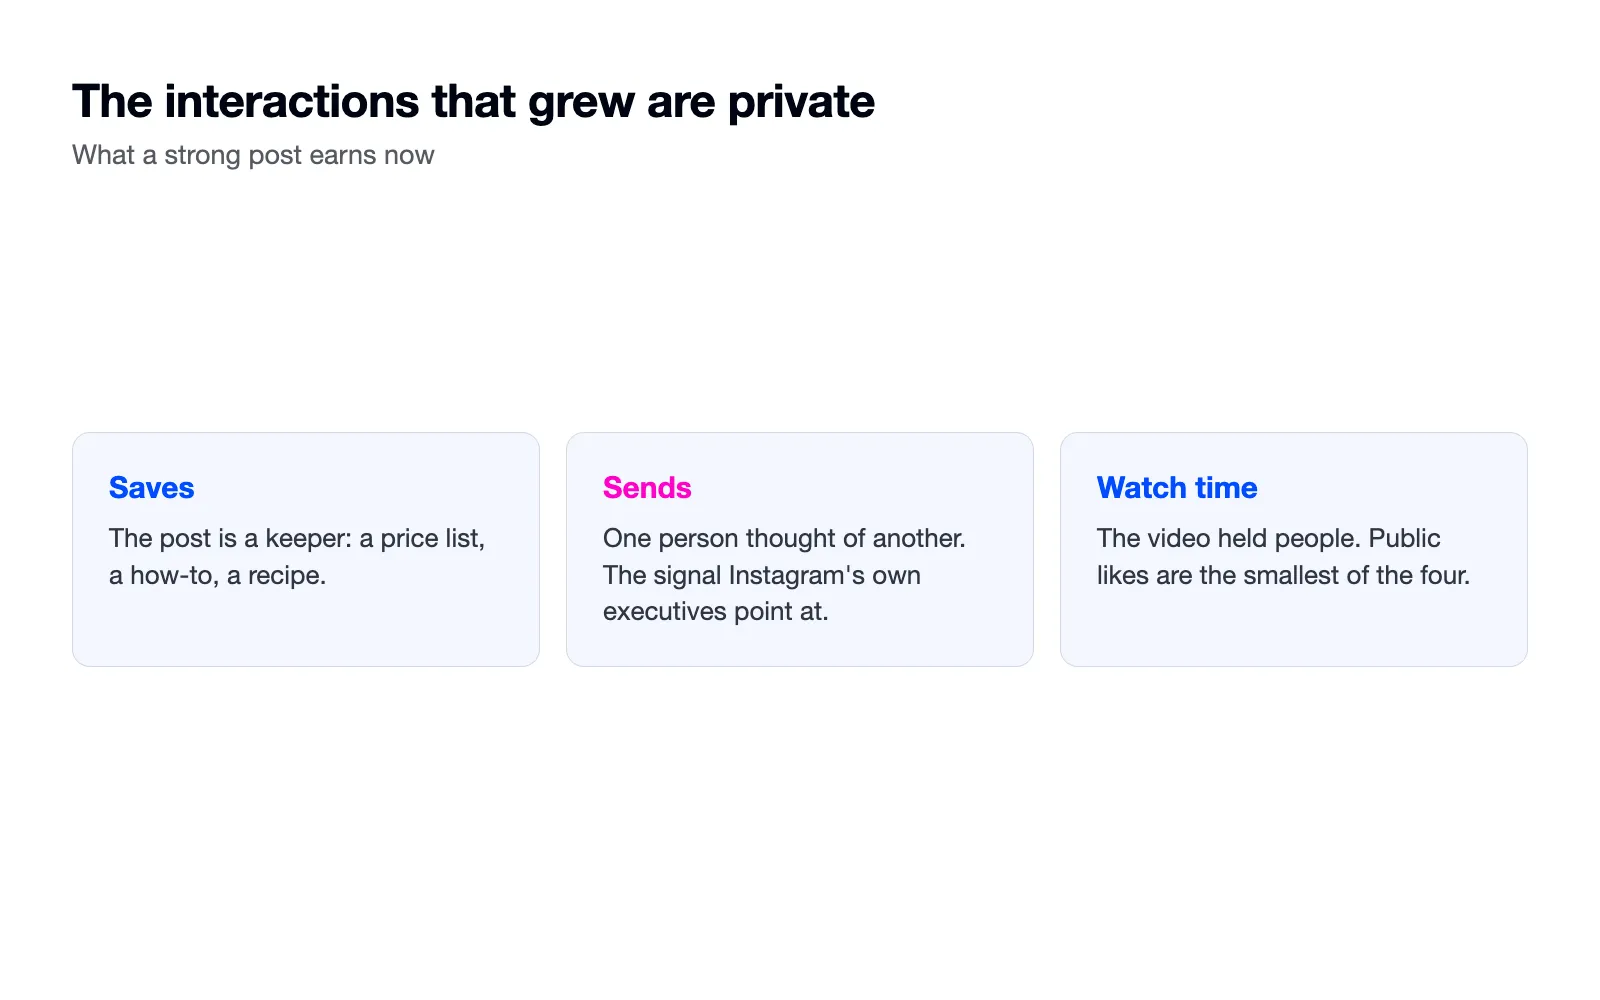
Public likes are a shrinking share of what happens on Instagram. The interactions that grew are private: sends to a friend, saves for later, shares into group chats. Instagram's ranking follows the same direction, and sends per reach is the signal its own executives keep pointing at.
That changes what a strong post looks like. A post gets saved when it is worth returning to, like a price list, a how-to, a recipe. A post gets sent when one person thinks of another, like a line that names something a friend does, or an offer worth forwarding. Scroll your last month of content and ask which posts gave anyone a reason to save or send. If the answer is none, engagement has nowhere to come from.
Instagram also handed viewers direct control in December 2025: people can now tell the app which Reels topics they want more or less of. That rewards content with a legible topic. A Reel that clearly signals what it is about gets filed correctly and lands with people who asked for the subject. A Reel that is vaguely about everything gets filed nowhere.
Originality counts here too. Instagram down-ranks recycled content, and a watermarked TikTok repost gets shown to fewer people from the moment it goes up. Post the native file.
Check four: the first line and the first frame
On Reels, viewers decide in the first two seconds whether to stay, and Instagram measures how many do. A Reel that opens with a logo card or a slow greeting loses the swipe before the content starts. A carousel earns its reach on the first slide the same way.
Check your ten worst performers. If they share an opening habit, you have found something cheap to fix. We cover hooks properly in a separate guide, but the two-second test is simple enough to run today: watch each post and ask what a stranger sees before they see the point.
Check five: who your followers actually are
An engagement rate divides by your audience, so who those followers are affects the number. If the account ever ran follow-to-win giveaways, bought followers in an optimistic past, or got a burst of followers from one viral post outside your subject, a slice of your audience never wanted what you sell. They do not engage, but they still count in your follower number, so your rate looks worse than your content is.
Check your audience insights against your actual customers: the locations, the age bands. A bakery in Leeds with a third of its followers overseas got them from an old giveaway, and those followers were never going to buy bread. You cannot remove them in bulk, but you can stop courting more of them, and you can judge your rate against reach instead of followers, which sidesteps the problem entirely.
What matters less than you think
Posting time is the variable people fiddle with most and the one that moves least. Buffer's engagement analysis is direct about the order: what you post matters most, how often you post matters a lot, and when you post matters least. If you are rescheduling posts hunting a magic hour, spend that energy on the post instead.
Season is the other quiet variable. Engagement dips in January and again in late summer for most consumer accounts, because audiences do. A slow month is only a signal when the same month last year was better, so compare year over year before blaming the algorithm for August.
What to change first
Do the checks in order, because they compound. Set your cadence at a number your worst week can survive. Rebalance your formats toward what your own top ten shows. Build the next month of posts so that most of them give someone a reason to save or send. Fix the openings on the formats you keep.
Then hold everything steady for four weeks and measure the same reach-based rate you wrote down at the start. One month is short enough to stay patient and long enough for the feed to notice you are consistent.
And if the numbers stay flat after a month of honest checking, the problem is deeper than the checklist, in what you sell or how you talk about it. That 90-day review is the first half of our audit. If you would rather we did the digging and handed you the list, book it and we will.

Georgia May
CEO & Founder of Tea & Toast